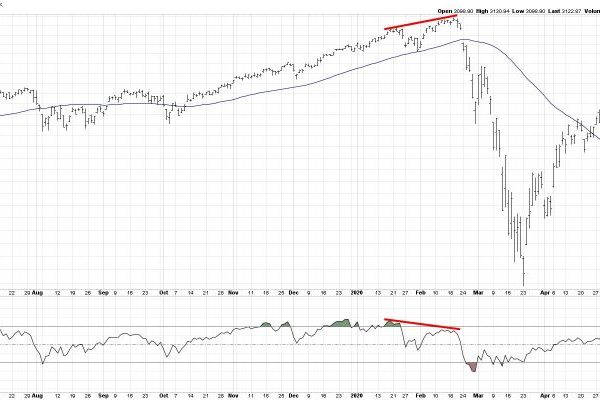
Bearish Divergence Suggests Caution For S&P 500

With Friday’s pullback after a relatively strong week, the S&P 500 chart appears to be flashing a rare but powerful signal that is quite common at major market tops. The signal in question is a bearish momentum divergence, formed by a pattern of higher highs in price combined with lower peaks in momentum, which indicates weakening…

Read More

3 S&P 500 Charts That Point to the Next Big Move

Follow along with Frank as he presents the outlook for the S&P 500, using three key charts to spot bullish breakouts, pullback zones, and MACD signals. Frank compares bearish and bullish setups using his pattern grid, analyzing which of the two is on top, and explains why he’s eyeing SMCI and AMD as potential trades….

Read More

The Secret To Streamlining Your Charting Workflow

Grayson explores a hidden gem on the SharpCharts platform: StyleButtons! These handy little customizable tabs give you quick, one-click access to your favorite chart templates, allowing you to jump from ChartStyle to ChartStyle with a seriously streamlined charting workflow. Grayson demonstrates how to create and save ChartStyles and assign them to StyleButtons in your account…

Read More

10 Silver ETFs for Every Investing Style in 2025

Investors looking for exposure to the silver price and silver-mining companies should consider silver exchange-traded funds (ETFs). Spurred by moves in the gold market, safe haven buying as well as increasing demand from industrial sectors, silver saw strong price movements in the first half of 2025, breaching US$37 per ounce for the first time since…

Read More
Back To Top