How to Use Fibonacci Retracements to Spot Key Levels

Join Dave as he shares how he uses the power of Fibonacci retracements to anticipate potential turning points. He takes viewers through the process of determining what price levels to use to set up a Fibonacci framework, and, from there, explains what Fibonacci retracements are telling him about the charts of NCLH, RTX, and the…

Read More

The Best Five Sectors, #24

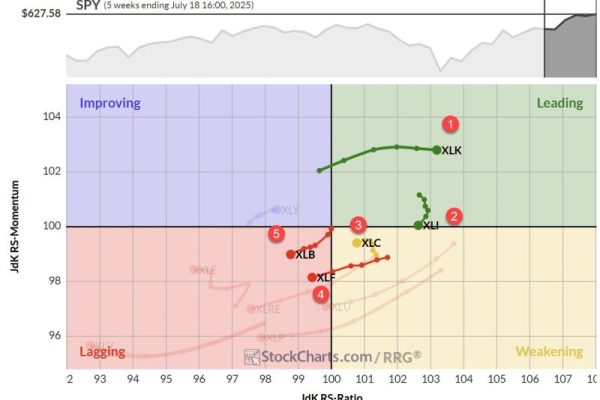
Some Sector Reshuffling, But No New Entries/Exits Despite a backdrop of significant geopolitical events over the weekend, the market’s reaction appears muted — at least, in European trading. As we assess the RRG best five sectors model based on last Friday’s close, we’re seeing some interesting shifts within the top performers, even as the composition…

Read More

Lagging Mid-cap ETF Hits Moment of Truth

The S&P MidCap 400 SPDR (MDY) is trading at a moment of truth as its 5-day SMA returns to the 200-day SMA. A bearish trend signal triggered in early March. Despite a strong bounce from early April to mid May, this signal remains in force because it has yet to be proven otherwise. Today’s report…

Read More

US Strikes Iran: What Comes Next For Stocks?

In today’s “Weekly Market Recap”, EarningsBeats.com’s Chief Market Strategist Tom Bowley looks ahead to determine the likely path for U.S. equities after the weekend bombing of Iran nuclear sites. Are crude prices heading higher? Will energy stocks outperform? What additional roadblocks might we have to negotiate after the latest Fed meeting and policy statement? Could…

Read More

3 S&P 500 Charts That Point to the Next Big Move

Follow along with Frank as he presents the outlook for the S&P 500, using three key charts to spot bullish breakouts, pullback zones, and MACD signals. Frank compares bearish and bullish setups using his pattern grid, analyzing which of the two is on top, and explains why he’s eyeing SMCI and AMD as potential trades….

Read More
Back To Top